
Keywords: driver profiling, driver safety, road safety analytics, driver scores, driver coaching, trip analytics, distracted driving detection, driving intelligence, phone handling, driving behavior, road safety collision detection, crash detection, hard braking, driving habits, driving regulations, geographical differences
Introduction
Driver profiling is one of the core functionalities of the Sentiance platform. Valuable insights into how people drive can be extracted from analyzing low-level sensor data collected by smartphones. In this blog post, we describe the power and flexibility of our driver scoring framework. Our framework allows our clients to tailor driving scores according to their unique needs, which may also tie in with culture and geography.
While we provide standard driving scores that are calibrated and have been repeatedly benchmarked by our clients. We also offer a flexible framework that can accurately adapt to unique client needs. For example, a company transporting fragile cargo wants to enforce smooth driving for reduced breakages.
Tailored driving score for specific needs
As Sentiance is active in different mobility verticals, we can adapt our standard solution to different use cases. A fleet management company may want to encourage safe and fuel-efficient driving. A ride-hailing company will want to increase passenger satisfaction by improving their drivers’ skills through coaching. A car insurance company will want to incentivize their customers to drive safely by offering discounts on their policy (Figure 1).

Figure 1: Various requirements in different mobility verticals
Each use case comes with its own technological requirements. Fuel-efficient driving and passenger comfort are not under the same driving features. Even a single use case can involve different features, depending on the company or country. Driving habits and regulations also vary in different countries. Sentiance technology factors in both geographical and cultural differences.
Transport processing layer
Sentiance SDK, which is embedded in the mobile apps of our clients, automatically detects users’ movement from one location to another. It collects accelerometer, gyroscope, and low-frequency location data. Once on our platform, the data goes through the pipeline shown in Figure 2. The output will contain enriched trajectory and driver scoring information.
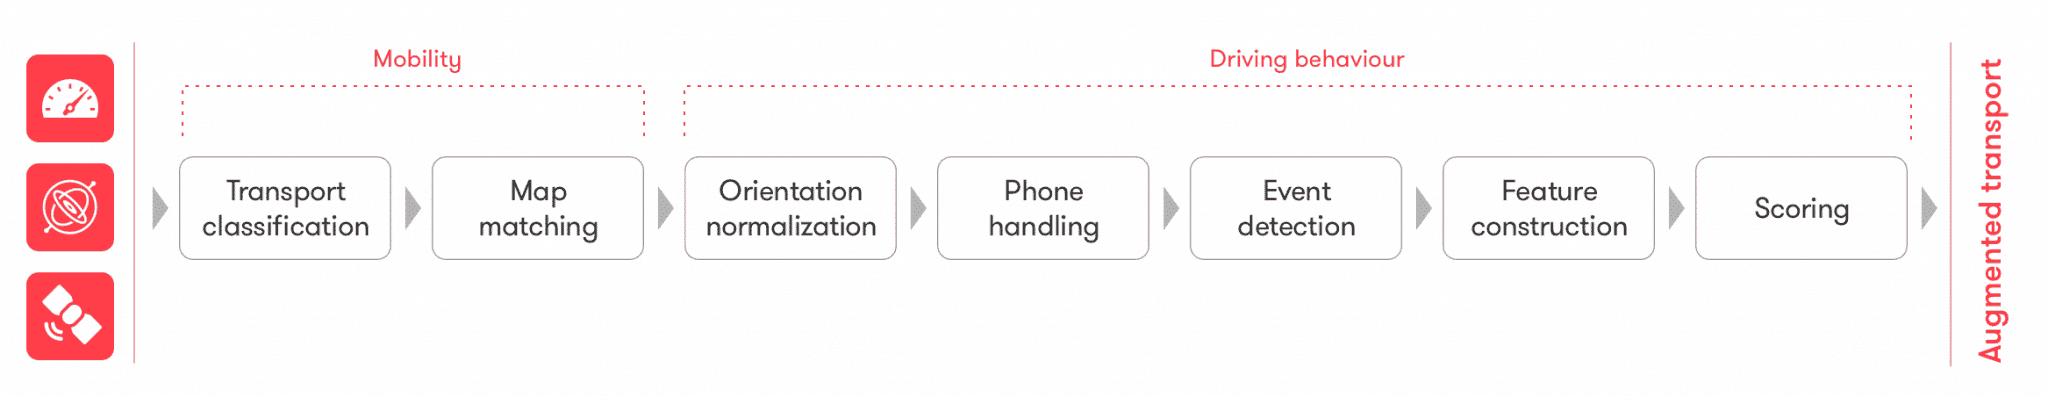
Figure 2: The transport processing pipeline
The first level of processing - transport classification - consists of segmenting and classifying the transport modes of each user. For example, whether the user was in a car, bus, train, tram, bike, or any other transport mode.
Next, raw GPS waypoints are map matched, i.e. the most probable trajectory on a route is found. As we only collect GPS fixes every 20 seconds to save battery life, we internally developed a graph optimization algorithm to efficiently solve this issue. Based on that trajectory, we can calculate the vehicle speed, and retrieve other important information, such as speed limits and road types.
During a car trip, mobile phones end up in arbitrary orientations which will affect how the car accelerations are distributed over the mobile sensor readings. Using advanced sensor fusion techniques, we align the referential of the phone with the referential of the car (Figure 3).
To learn more about orientation normalization, read our previous blog post.
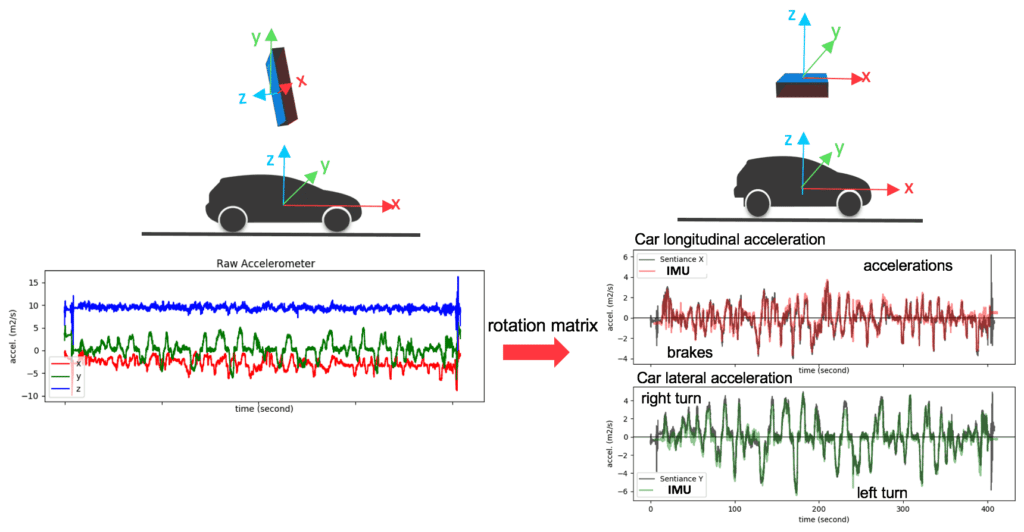
Figure 3: Accelerometer before (left) and after (right) orientation normalization. After alignment, linear accelerations of the car can be calculated from the phone sensors. The colored curves in the right picture correspond to measurements collected on a professional Inertial Measurement Unit (IMU) in tests performed by external parties. The Sentiance solution outputs (in black) are indistinguishable from high-end IMU.
Driver scoring framework
To serve clients active in diverse verticals, we have developed a flexible scoring framework that can meet clients’ requests and which requires minimal development.
The first differentiator of our platform is the richness of the inputs to that scoring pipeline. From the pipeline shown in Figure 2, our platform will extract, for each trip, a rich set of driving events and information from low-level sensors.
Besides basic info such as:
- Trip distance
- Trip duration
- Speed limits
Several driving events characterizing a trip are derived:
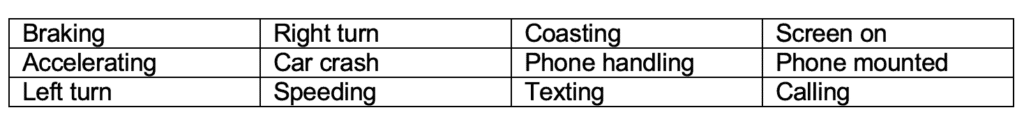
Our technology can detect driving events such as braking, accelerating, and turns if the underlying signals cross customizable thresholds, both in magnitude and duration. We characterize each individual event by its duration and additional information such as peak magnitude and average energy.
We calculate different driving events and therefore driving scores for different contexts such as:
- Daylight/night
- Weather condition
- Traffic condition
- Road type
- Trip context (commute, kids drop off, leisure trip…)
There are many ways to combine driving events to derive driving scores. While Sentiance provides ready-to-use driving scores, we give the opportunity to our clients to easily create their own.
The generic driver scoring framework is shown in Figure 4. Events of interest are processed individually first then potentially combined with each other. The pipeline can focus on a single event type or combine as many as needed.
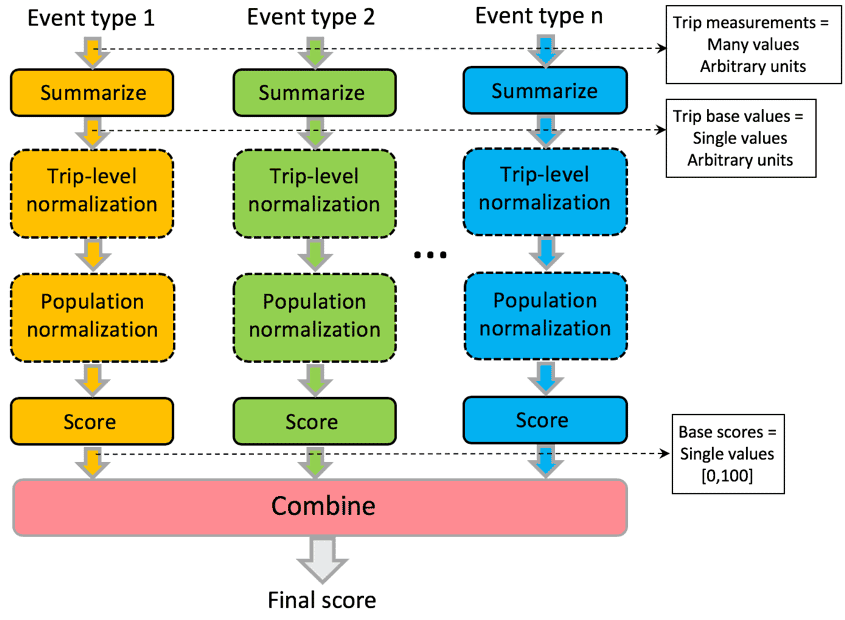
Figure 4: Sentiance scoring framework. Blocks in dashed-lines are optional.
1) Summarize trip into a single base value
For each event type considered, e.g. braking, turning, speeding, an entire trip is summarized into a single value.
Let’s look at different examples.
Example 1 - One could describe a trip by calculating the peak magnitude of all acceleration events detected. Taking the average of those values would yield a single value characterizing the average acceleration behavior during that trip.
All acceleration peak values -> Mean -> Average acceleration behavior
Example 2 - Instead of looking at average statistics we could also focus on events we consider dangerous. For instance, braking events could be considered dangerous beyond a customizable threshold. We can summarize the trip by simply counting the number of hard events.
All hard braking events -> Count -> Number of hard braking events
Example 3 - To describe speeding behavior, one could take the ratios between instantaneous car speed and speed limit at each point along the trip trajectory. Taking the mean of this vector of ratios would be informative about the degree of over-speeding.
The ratio between all speeding events and speed limits -> Mean -> Average degree of over-speeding
The possibilities are endless. The only requirement is to yield a single value from the many variables describing a collection of driving events during a trip.
2) Normalize at trip level
Trip-level normalization implements intra-trip normalization: base values extracted in step 1 can be normalized with respect to other variables from the same trip. Let’s look at different examples:
Example 1 - Normalizing by trip distance and duration are the most straightforward. For instance, distance while speeding can be normalized by the total driving distance to yield the proportion of over-speeding. The total duration of phone handling can be normalized by the total duration.
Example 2 - The number of dangerous braking events can be normalized in different ways, yielding different insights. One could normalize by the trip distance, yielding the number of dangerous events per kilometer. The drawback is that 10km on a high way induce a different driving style than 10km in the mountains.
To take into account road type context, we can normalize the number of hard braking events by the total number of braking events detected.
Note:
In order to provide an intuitive score that can be acted upon for coaching, one might want to bypass trip-level normalization and just pass the absolute number of hard events.
3) Population Normalization
Our framework allows our clients to designate a specific population against which their scores should be normalized.
Sometimes we are required to express a score for a specific population, either based on vehicle type, geography, or client-specific population. By doing so, a client can answer a question such as:
“To which extent is this user’s driving smoother than an average user’s?”
In order to derive the population normalization function, we compute (trip-normalized) base values from thousands of trips for a given population (Figure 5, left). We then use their corresponding cumulative distribution as the function to normalize trip base values and yield scores between 0 and 100.
Say that base value for a speeding ratio is 1.4 and is mapped to 87%. This means that 87% of the population base values will be lower and 13% will be higher. Our approach allows for a quick and powerful way of comparing individual values to population statistics.
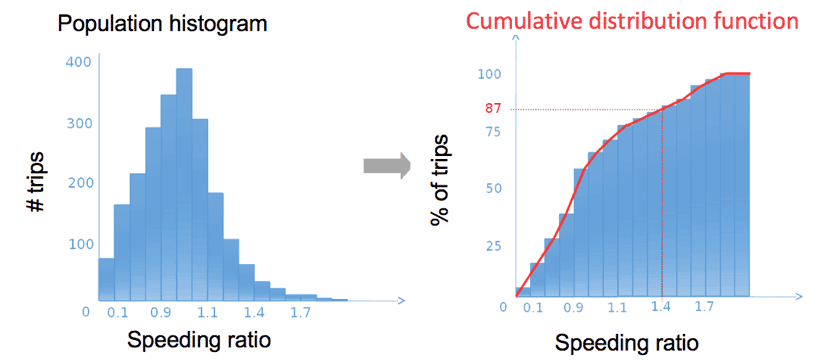
Figure 5: Illustration of population normalization.
4) Base Score Calculation
To calculate a base score from derived trip summary values, a transformation, linear or non-linear, is performed. The base scores will have a value ranging between 0 (denoting a bad score) to 100 (representing a perfect score).
We can use a non-linear transformation to focus on value ranges where drivers will be sanctioned (Figure 6). For example, one could want to penalize users who have more than 5 hard brakes per trip. The slope of the transformation would define how fast a user is penalized.
In order for the users to perceive a normal score as positive, we can transform the score so that the distribution has a certain minimum, such as 30%.
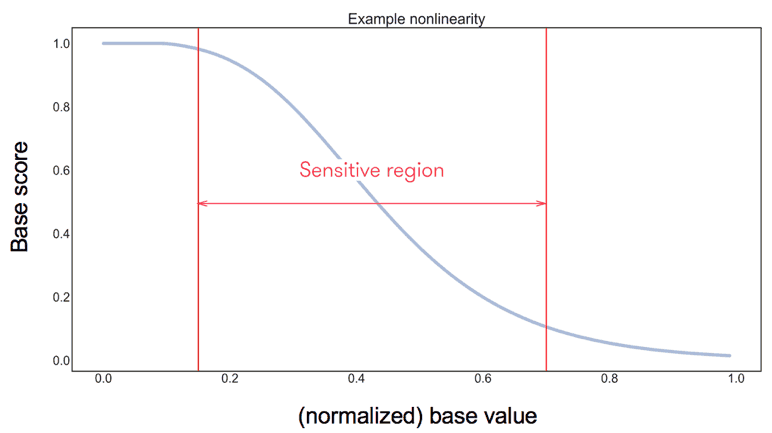
Figure 6: A possible nonlinear transformation, a generalized sigmoid function
5) Multiple base score combination
The last block in Figure 4, the score combiner block, combines the resulting base scores of multiple pipelines of the previous blocks into one final score. Typically, this entails taking a weighted average over several base scores. Combinations are unlimited and will depend on the use case of interest. Some clients will want to derive a score combining phone handling, hard brakes, and speeding, with an emphasis on the first two elements. Other clients will prefer to combine brakes and right turns in order to quantify risky trips.
Factoring in location
Linking driving behavior to the geographic context is important as divers behave differently in different areas. Drivers in Islamabad have different driving habits than drivers in Rotterdam or Phoenix. Accelerating and braking often is normal in urban environments, but hard acceleration may indicate a dangerous driving style in certain areas. This is not necessarily the case when accelerating on a highway.
To factor in both geographical and cultural differences, we, therefore, normalize our scores based on sub-populations. This allows our final scores to be compared and aggregated, even across different regions in the world.
Conclusion - driving score
Our standard scores are calibrated and have been repeatedly benchmarked by our clients. We also have a flexible framework that can accurately adapt to unique client needs.
In addition to what we have introduced above, insurance and mobility providers may have more questions:
- Should the score correlate with risk, passenger comfort, ecological footprint, car maintenance, or something completely different?
- Do certain events need to be penalized in an absolute or relative way?
- Shall we make driving scores relative to the population? Or have a clear idea about what exactly to personalize and to which extent?
- How about a combination of several base scores (like accelerating, braking, turning and speeding)? Or separate scores for all event types?
We will be more than happy to assist you in creating scores (including driving score) suited for your use case. For more information, you can download our demo app Journeys, or contact us!
These are some key clients already making use of our driving scoring technology: